# -*- coding: utf-8 -*-
"""
Created on Tue Feb 22 19:23:49 2022
@author: sigur
"""
import math as m
import matplotlib.pyplot as plt
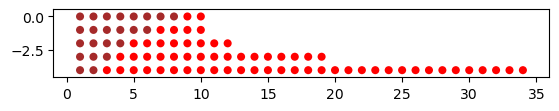
antall_generasjoner = 5
radius = 5
avstand = 10
x_start=1
y_start=0
x = x_start
y = y_start
brune = 8
rode = 2
plt.clf()
plt.axes()
for i in range(antall_generasjoner):
#skriver ut antallet av hver type fugl
print("andtall brune: "+ str(brune))
print("antall røde: " + str(rode))
#tegner en sirkel for hver fugl, røde og brune
for j in range(brune):
plt.gca().add_patch(plt.Circle((x, y), radius=0.3, fc='brown'))
x+=1
for j in range(rode):
plt.gca().add_patch(plt.Circle((x, y), radius=0.3, fc='red'))
x+=1
# regner ut neste iterasjon
rode = m.floor(rode * (1/2))
brune = m.floor(brune * (3/4))
rode = rode * 4
brune = brune
x=x_start
y-=1
plt.axis('scaled')
plt.show()
print("ferdig")